chiloong@vslashr.com
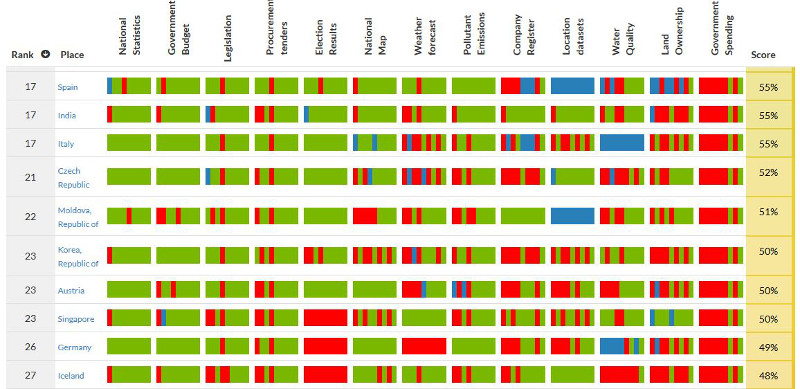
Visualizing Singapore

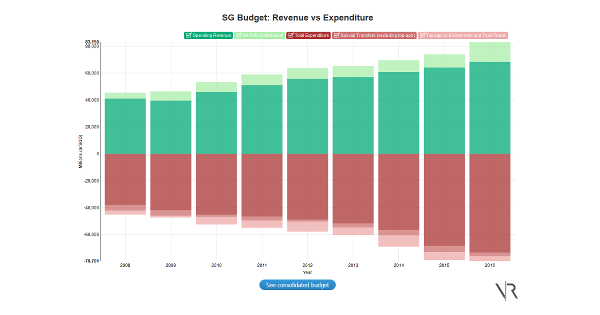
Story Time: Budget
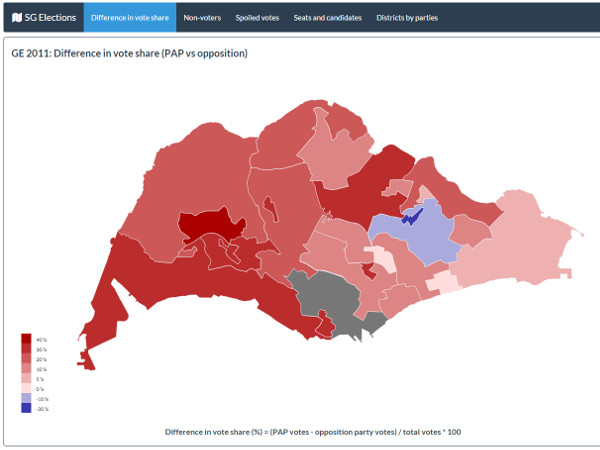
Story Time: GE 2015
Dengue + Zika
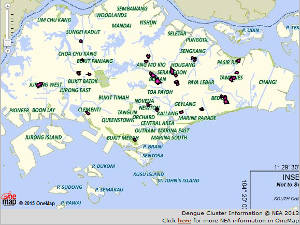
NEA website
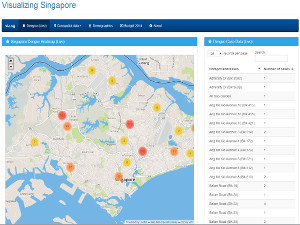
Dengue + Zika visualization
Population Demographics
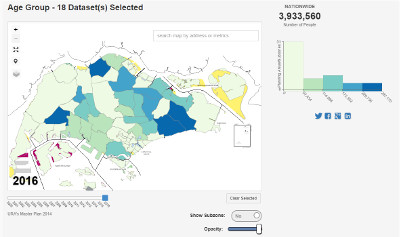
Onemap: Population Query
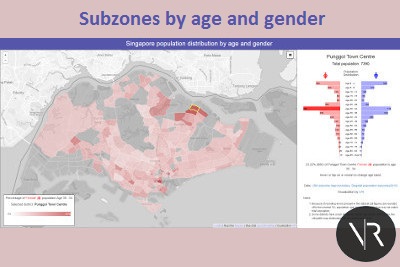
Subzone: Age + Gender
Taxi Availability
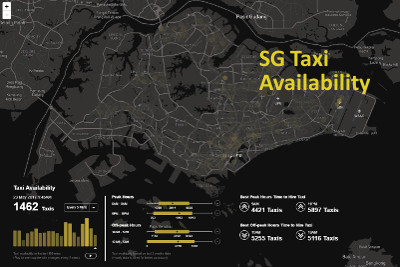
By: Yongquan Ben
Isochronic

By: Shangyang, Swarm.is
ClinicQueue SG
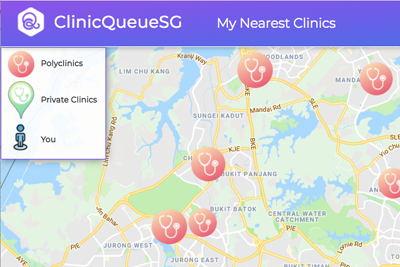
By: Hanif Salim and team
School Picker
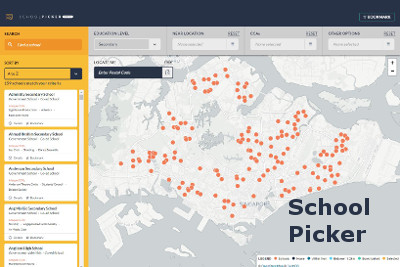
By: Datagov.sg (Yong Jun and Li Wei)