Visualization for Transport Simulator
Proposal for A*Star
Please view the web version at http://decks.vslashr.com/transportsim for a better user experience of this proposal.
Objectives
Design and develop a front-end platform for the visualisation of public transport network and its related performance metrics.
Requirements
- Must be multi-modal and incorporate all forms of public transport: buses, trains, taxis, bike shares.
- Must be a front-end web-based application that interfaces with A*Star's backend via REST API calls.
- Platform should be as modular as possible - components can be deployed to other platforms.
- Must have responsive web design and work on multiple different form factors.
- Must be capable of representing over 30,000 dynamic entities (buses/taxis/trains) and ~5,000 static entities (bus & train stops).
Proposal
Tech: Vue Stack
Vue, our frontend MVVC framework of choice.
This framework stack helps with componentization, extension, reactivity.
- Vue Stack: Vanilla Vue / Vuex (state management) / Nuxt (design pattern for organization, routing)
- Vue is a modern, popular, robust framework for frontend MVVC, with lots of libraries and support.
- Here's a comparison on why Vue vs other MVVC frameworks.
- We tend to like frameworks that are more flexible (easy to scale up/down) and less prescriptive. We also prefer templates to JSX.
Tech: Viz + other libraries
- D3. D3.js is the defacto visualization library for the web, and for good reason: Powerful, performant, designed with visualization in mind.
- Mapbox. Built on top of open source Leaflet, Mapbox is an excellent spatial library (styling, layers, etc.)
- Axios. Modern library for AJAX calls
- Babel. For browser polyfills.
- Webpack. Module bundler.
- ESLint. Linter for standardized code.
- Vuetify. Material Design CSS framework. For responsiveness and design.
Tech: Licenses
| Software package | License | Purpose |
Vue / Vuex / Vuetify / Nuxt |
MIT |
MVVM architecture |
D3 |
BSD |
Data vis |
Mapbox |
BSD |
Maps |
Axios |
MIT |
Ajax |
Babel |
MIT |
Polyfills |
Webpack |
MIT |
Bundler |
ESLint |
MIT |
Linter |
Tech: Frontend graphics
- For main map, likely to be a canvas-based overlay on-top of mapbox-gl (WebGL) based tiles.
- Interaction to be done using custom canvas code.
- On smaller charts, will likely use SVG as it has event handlers, easy resizing, etc.
UX Philosophy
- From a UX flow perspective, I prefer more controlled narratives for simplicity and ease of use.
- This means making more decisions for the end user by default that will serve 80% of their use cases.
- The design is meant to aid investigating defined use cases, and extraneous functionality will be abstracted into configuration panes.
- Design will be clean, minimalistic, and functional.
- We use Google's Materials Design as a base guideline: Colors, Responsiveness, Typography.
- The ability to drill up and down the ladder of abstraction (for visualization) is important and will be kept in mind.
- I prefer icons (aesthetically appealing), but we will also have context-driven tooltips to aid usability.
Potential use cases
This portion will need to sit down with A*Star to get a good idea. These are just some thoughts from our end!
- Can we get an overall snapshot of traffic conditions in Singapore across different mode types?
- If a MRT train breaks down, how quickly can the situation be resolved by sending feeder buses?
- How often do taxi prowl around / wait for pickups? How distributed should they be to reduce waiting time?
Potential UX
Please note that these following slides are just rough UX ideas. The UX needs to be designed to fit defined use cases, as mentioned.
Top level: Spatial map
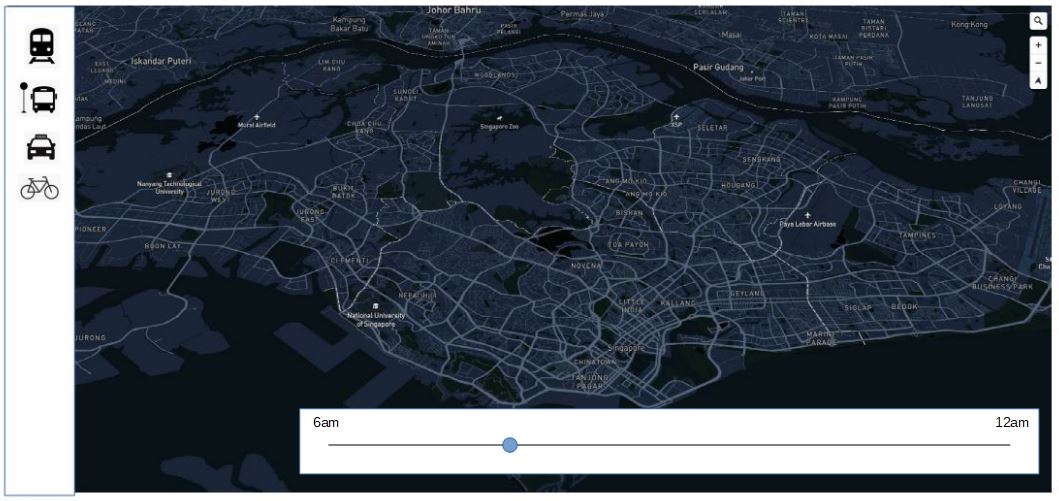
Each mode of transport will have its own object layers, and these will be drawn on the map.
You can select multiple layers.
Each mode - dashboard
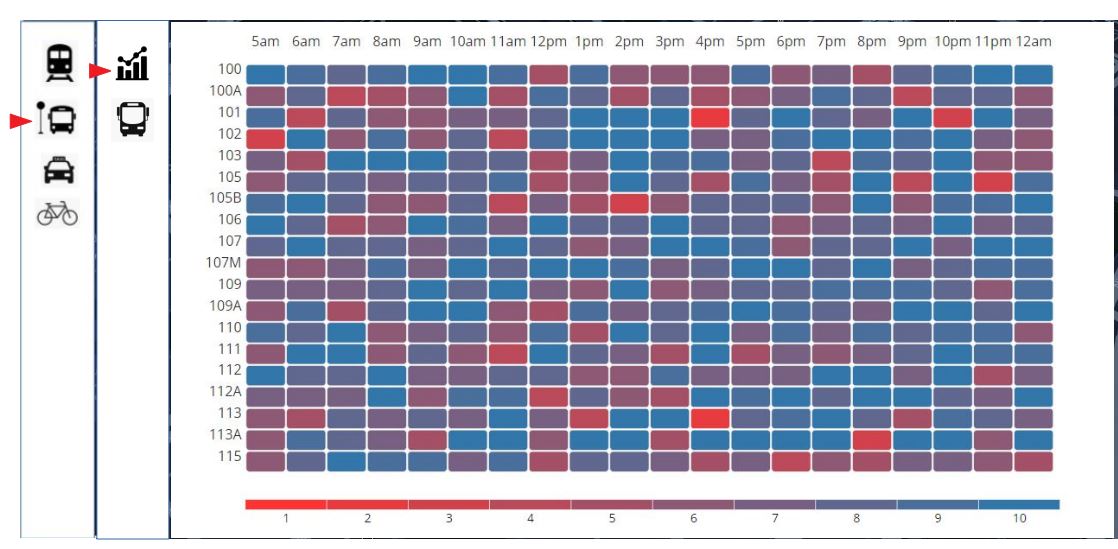
A dashboard specific to the mode of transport will pop up to show information relevant to that mode.
Each mode - spatial drill down
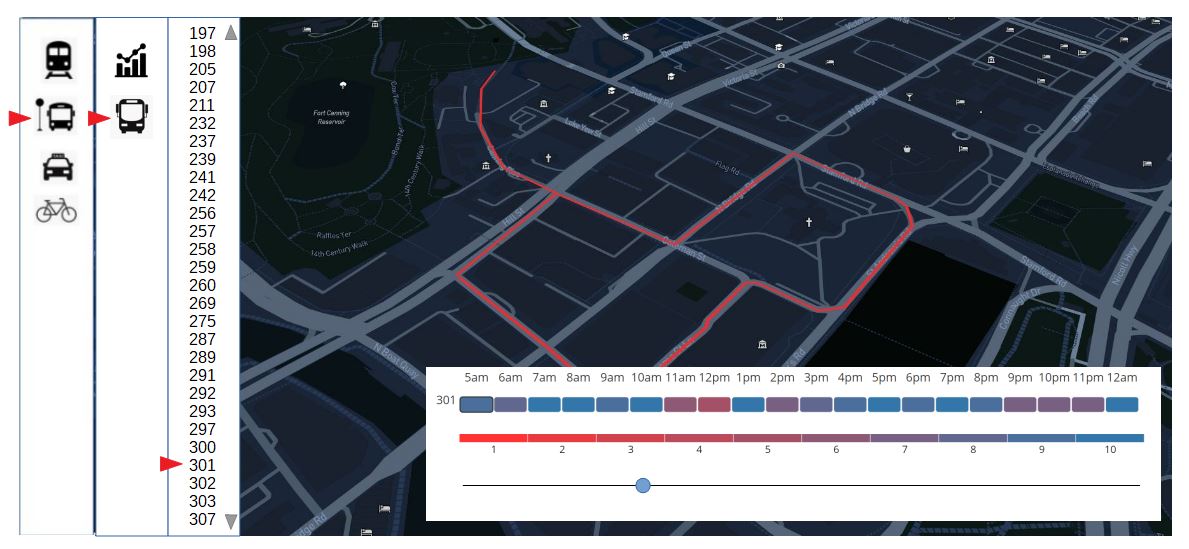
Drill down further to investigate each particular object in a way that makes sense for that mode.
UX ideas continued
We also need to cater for settings, configuration panes, and other views (e.g. maybe not by spatial, but by other metric like performance or time).
If there are multiple of these, and/or not spatial related, it will be a high level order menu (before the spatial map), like how we did Metro Metrics.
Otherwise it'll be a config menu item on the top-level spatial map.
Deployment
A modern Vue architecture stack is relatively easy to deploy.
This can be for local machines or on a cloud platform like Heroku.
Base source code is given, so A*Star can easily manage the dev / staging or production environment.
References
Frontend dashboard work
In this section is a selection of visualization dashboard work done for a variety of clients.
For A*Star, we helped create the frontend editor / visualization dashboard for Metro Metrics, so you already know what we can do.
Telco viz
Designed for a telco, this is a live visualization of transactions every two minutes between two locations.
Please note that this viz is showing simulated mock data (transactions are fake and generated). Actual viz is not supposed to.
Designed more of a showcase rather than analysis piece.
Security dashboard viz
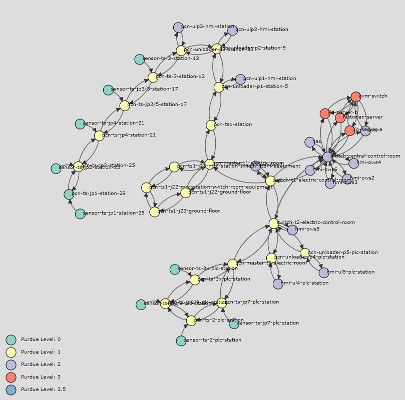
Designed for a security company, we envisioned how the nodes of a network would look like to show each node's attributes.
Project went though multiple iterations for UX exploration, including a constricted band design based on Purdue Level.
Visualizing Singapore

Visualizing Singapore is a curated repository of data visualizations on Singapore. Originally started as a V/R showcase site, it has now become more of a community site.
Examples: District demographics, to dengue / zika, to budget visualizations.
Budget / Timeframe
Budget
- Our preference is still to charge on a monthly timesheet agile basis, and cost only for what we bill.
- Costs will be based on man day rates at S$700 per day across all design and technical functions.
- All man days spent by V/R will be logged into itemized timesheets during the project schedule so that costing is tracked and transparent.
Budget 2
- I would suggest that the frontend dev + design should be at least a fifth to a quarter of the entire budget.
- Without knowing your exact budget, I would suggest an initial budget of 150 man days S$(105K) from our end for 6 months.
- There are a lot of unknowns and given that the UX spec still needs to be worked on after the project starts, this is only an estimate.
- Payments are only paid on an agile basis per month (for work done and agreed), so there is no overcosting / undercosting anyway.
- For payments, we prefer to bill monthly for all the hours clocked in the timesheets for that month.
Sample timeframe
Please note that this is very rough initial timeframe only.
| Item | Week |
Initial meetings, milestone and delivery planning |
1 |
Ideation, initial UX specifications, wireframes, research |
1 - 2 |
Delivery of 1st cut UX spec |
3 |
Production / Coding |
4 - 15 |
Spatial map viz prototype |
16 |
Production / Coding (polishing) |
17 - 22 |
Final UAT / Deployment |
23 - 24 |
Note that from the moment code work starts there will be weekly /fortnightly code reviews.
Process
- All work is broken down into weekly / fortnightly deliverables based on feedback and what needs to be done.
- For example, we billed Attilatech 10 days of work (S$7K) for this single viz prototype, but the process took about a month - chasing for feedback, reverts, etc.
- Prototypes are shown on V/R's staging test servers (links sent across), with emailed explanations on why we chose certain designs. Face-to-face meeting were done, but only as needed.
- Good communication will ensure that both sides expectations are managed.
Team and bios
V/R founder bios
Chi-Loong
Ex-journalist / PR / marketing / technology hybrid. Past lives in tech, in-house, agency, and media, like Straits Times, British Telecoms, and GollinHarris.
Kok Keong
Web and computing guru with a Master’s degree in networking. Past lives in academia and high-tech start-ups like Converscient and Antlabs. Founder of web tech company Mobrick.
Both founders each have about 15+ years of experience in their respective fields of work.
Team
Chi-Loong
Client management, UX, visualization
Kok Keong
Code architecture, frontend + backend
Clarence
Senior frontend
Chee Kiong
UAT, testing, deployment
Why V/R?
Why V/R?
In a nutshell, quality.
We design and build beautiful quality interactive work for clients.
Serious games, data visualizations, animations, apps.
We believe stories can be told better via UX + data .
We believe our work speaks for itself. Do check out our portfolio at V/R.
Questions?
+65 94355224